A stale compile cache ate our speculative decoder
Decode throughput quietly fell 4x with identical weights, image and flags. The drafter was replaying CUDA graphs compiled for a different feature set; one moved cache directory recovered 134.3 from 34.0 t/s.
A serving endpoint lost 3.95× of its decode throughput overnight and logged nothing. Same weights, same image digest, same launch flags, correct output throughout — the fleet's inference box went from a 34.0 to what should have been a 134.3 t/s BetterBench weighted decode, and the only instrument that noticed was a metrics counter nobody was reading. The cause was a stale compile cache feeding captured CUDA graphs to a speculative drafter. The fix was one variable: move the cache directory aside and restart unchanged.
The bench
Reproduction needs part-level context. This is an interim Chinese X99 board in a big chassis — the entry-level CPU under four server GPUs is a real confound and the reason to state it up front.
board        MACHINIST X99-D8 MAX, BIOS 5.11 (interim, non-production)
cpu          2x Intel Xeon E5-2620 v4 (8C/16T each, 2.10 GHz base)
memory       396 GB DDR4 (configured speed unverified this session)
gpus         4x AMD Radeon AI PRO R9700 32 GB (gfx1201)
kernel       7.1.5-p2p (local patches)
stack        radiance 0.9.3 / vllm 0.27.1 / torch 2.11.0+rocm7.14
             triton 3.6.0 / aiter 0.1.17 / transformers 5.14.1 / ROCm 7.14.0
The serve runs TP=2 on one socket-local pair. Cross-socket HIP IPC fails on this platform (hip_err=17), so every accelerated all-reduce in a straddling TP group host-stages through shared memory; a socket-local pair avoids that entirely.
GPU0  05:00.0   Gen3 x16   numa 0   <- in the TP pair
GPU1  09:00.0   Gen3  x8   numa 0   <- in the TP pair; x8 is PERMANENT
                                     (IIO bifurcated, other 8 lanes = ConnectX)
GPU2  86:00.0   Gen3 x16   numa 1
GPU3  89:00.0   Gen3 x16   numa 1
(All links verified via pp_dpm_pcie; no BadTLP accumulation this boot.)
The symptom: speculative decoding fails silently
Speculative decoding is lossless — the target model verifies every drafted token, so a drafter that is wrong on every token produces byte-identical output, just slower. Nothing fails. Nothing logs. The flags still say the feature is on. The only witnesses are three Prometheus counters: drafts issued, tokens drafted, tokens accepted.
quantity                    2026-09-09    2026-09-16 (broken)
acceptance length             3.766          1.079
draft-token acceptance       39.82 %         2.70 %
draft tokens per step         6.946          2.960
position-0 acceptance            -            6.70 %
Acceptance length 1.0 means speculation bought exactly nothing — the verify step emitted its own token and rejected every draft. The serve still answered everything correctly, at a quarter speed, for four days.
Three wrong hypotheses first
The first suspect was a mispaired drafter checkpoint. Refuted: a week-old record measured acceptance 3.766 with the identical target, drafter, and backend paths. The second was "the MXFP4 fast path is disabled" — an allowlist check that excludes this GPU, backed by a grep of the running environment. Also refuted: the grep was piped through head -10 and truncated immediately above the two lines enabling it. A bounded search that cuts off before the answer reads exactly like a negative result. The third was two drafters double-counting; the counters' own arithmetic killed it (Δdrafts 170 + Δaccepted 27 ≈ Δgeneration 200 — one drafter, accepting almost nothing).
I also retracted a version claim along the way: an environment variable said radiance 0.6.2, and for half a night the working theory was version skew against a 0.9.3 upstream. The image's own component banner said 0.9.3 all along. An environment variable is a claim; the running artifact is the measurement.
The mechanism
A DFlash-style drafter is built around replaying one captured CUDA graph per shape. vLLM's compile caches key on the resolved configuration — model, image digest, tensor parallelism, speculative config, feature toggles. On 2026-09-06 the launcher was re-pinned: new image, new model paths, new draft arm. The cache directory name did not change. When the serve restarted on 09-13, it loaded byte-valid graphs compiled for the previous feature set — the exact "wrong hit is worse than a miss" case, because a stale graph loads happily and produces plausible garbage. Plausible garbage, in a drafter, means drafts that almost never match the target. Verification rejects them, output stays lossless, throughput quarters.
One variable
Everything about the launch stayed byte-identical — same catalog entry, same launcher, same environment, same cards. The cache directory was moved aside (never deleted; it is both the evidence and the rollback) and the launcher re-run:
mv /mnt/models/cache/qwen38-27b-mxfp4-radiance-093{,.stale-$(date +%Y%m%dT%H%M%S)}
bash /opt/horde-serves/qwen38-27b-mxfp4-r9700-serve.sh
A cold start on this stack measured 594 s with a warm floor of 320 s; the restart came healthy at 600 s — on the cold floor, confirming the fresh compile actually happened. That matters: an invalidation that silently hits a warm cache is the no-op failure mode, and it looks identical to a working fix until the counters say otherwise.
Settings
image          sha256:bebc00145d7d… (radiance 0.9.3 stack, pinned by launcher)
target         /mnt/models/radiance/Qwen3.8-27B-MXFP4-mtpfp8 (19.4 GB safetensors)
drafter        /mnt/models/radiance/Qwen3.8-27B-DFlash2-FP8, SPEC=7, dflash2-fp8 arm
topology       TP=2 socket-local pair (05:00.0 + 09:00.0, numa 0)
context        max_model_len 262144, max_num_seqs 8, gpu_memory_utilization 0.97
speculation    rerank 80, verify_head 1, fast_draft 1, draft depth 7
env (subset)   RADIANCE_MXFP4=1 RADIANCE_MXFP4_W4A8=1 RADIANCE_USE_R4D=1
               RADIANCE_USE_R4D_AR=1 RADIANCE_PRESHUFFLE=1 RADIANCE_FUSE_RMS_QUANT=1
measured with  BetterBench 0.4.0 (corpus 1.0, schema 2) + a /metrics delta probe
Speed
Two instruments, same box, before and after. The probe takes a /metrics delta across a quiet window (4 reps per arm); BetterBench ran 20 passes per category, temp 0.7, cold prefix-cache, 3 warmup passes — warm floors, not first-run pairs.
betterbench run --passes 20 --warmup 3 \
  --endpoint http://127.0.0.1:8218/v1 --model qwen3.8-27b-mxfp4 --decode
                              broken      fixed
acceptance (greedy)             1.079      3.315
acceptance (sampled @0.7)       1.041      3.018
draft tokens per step            2.96       7.00
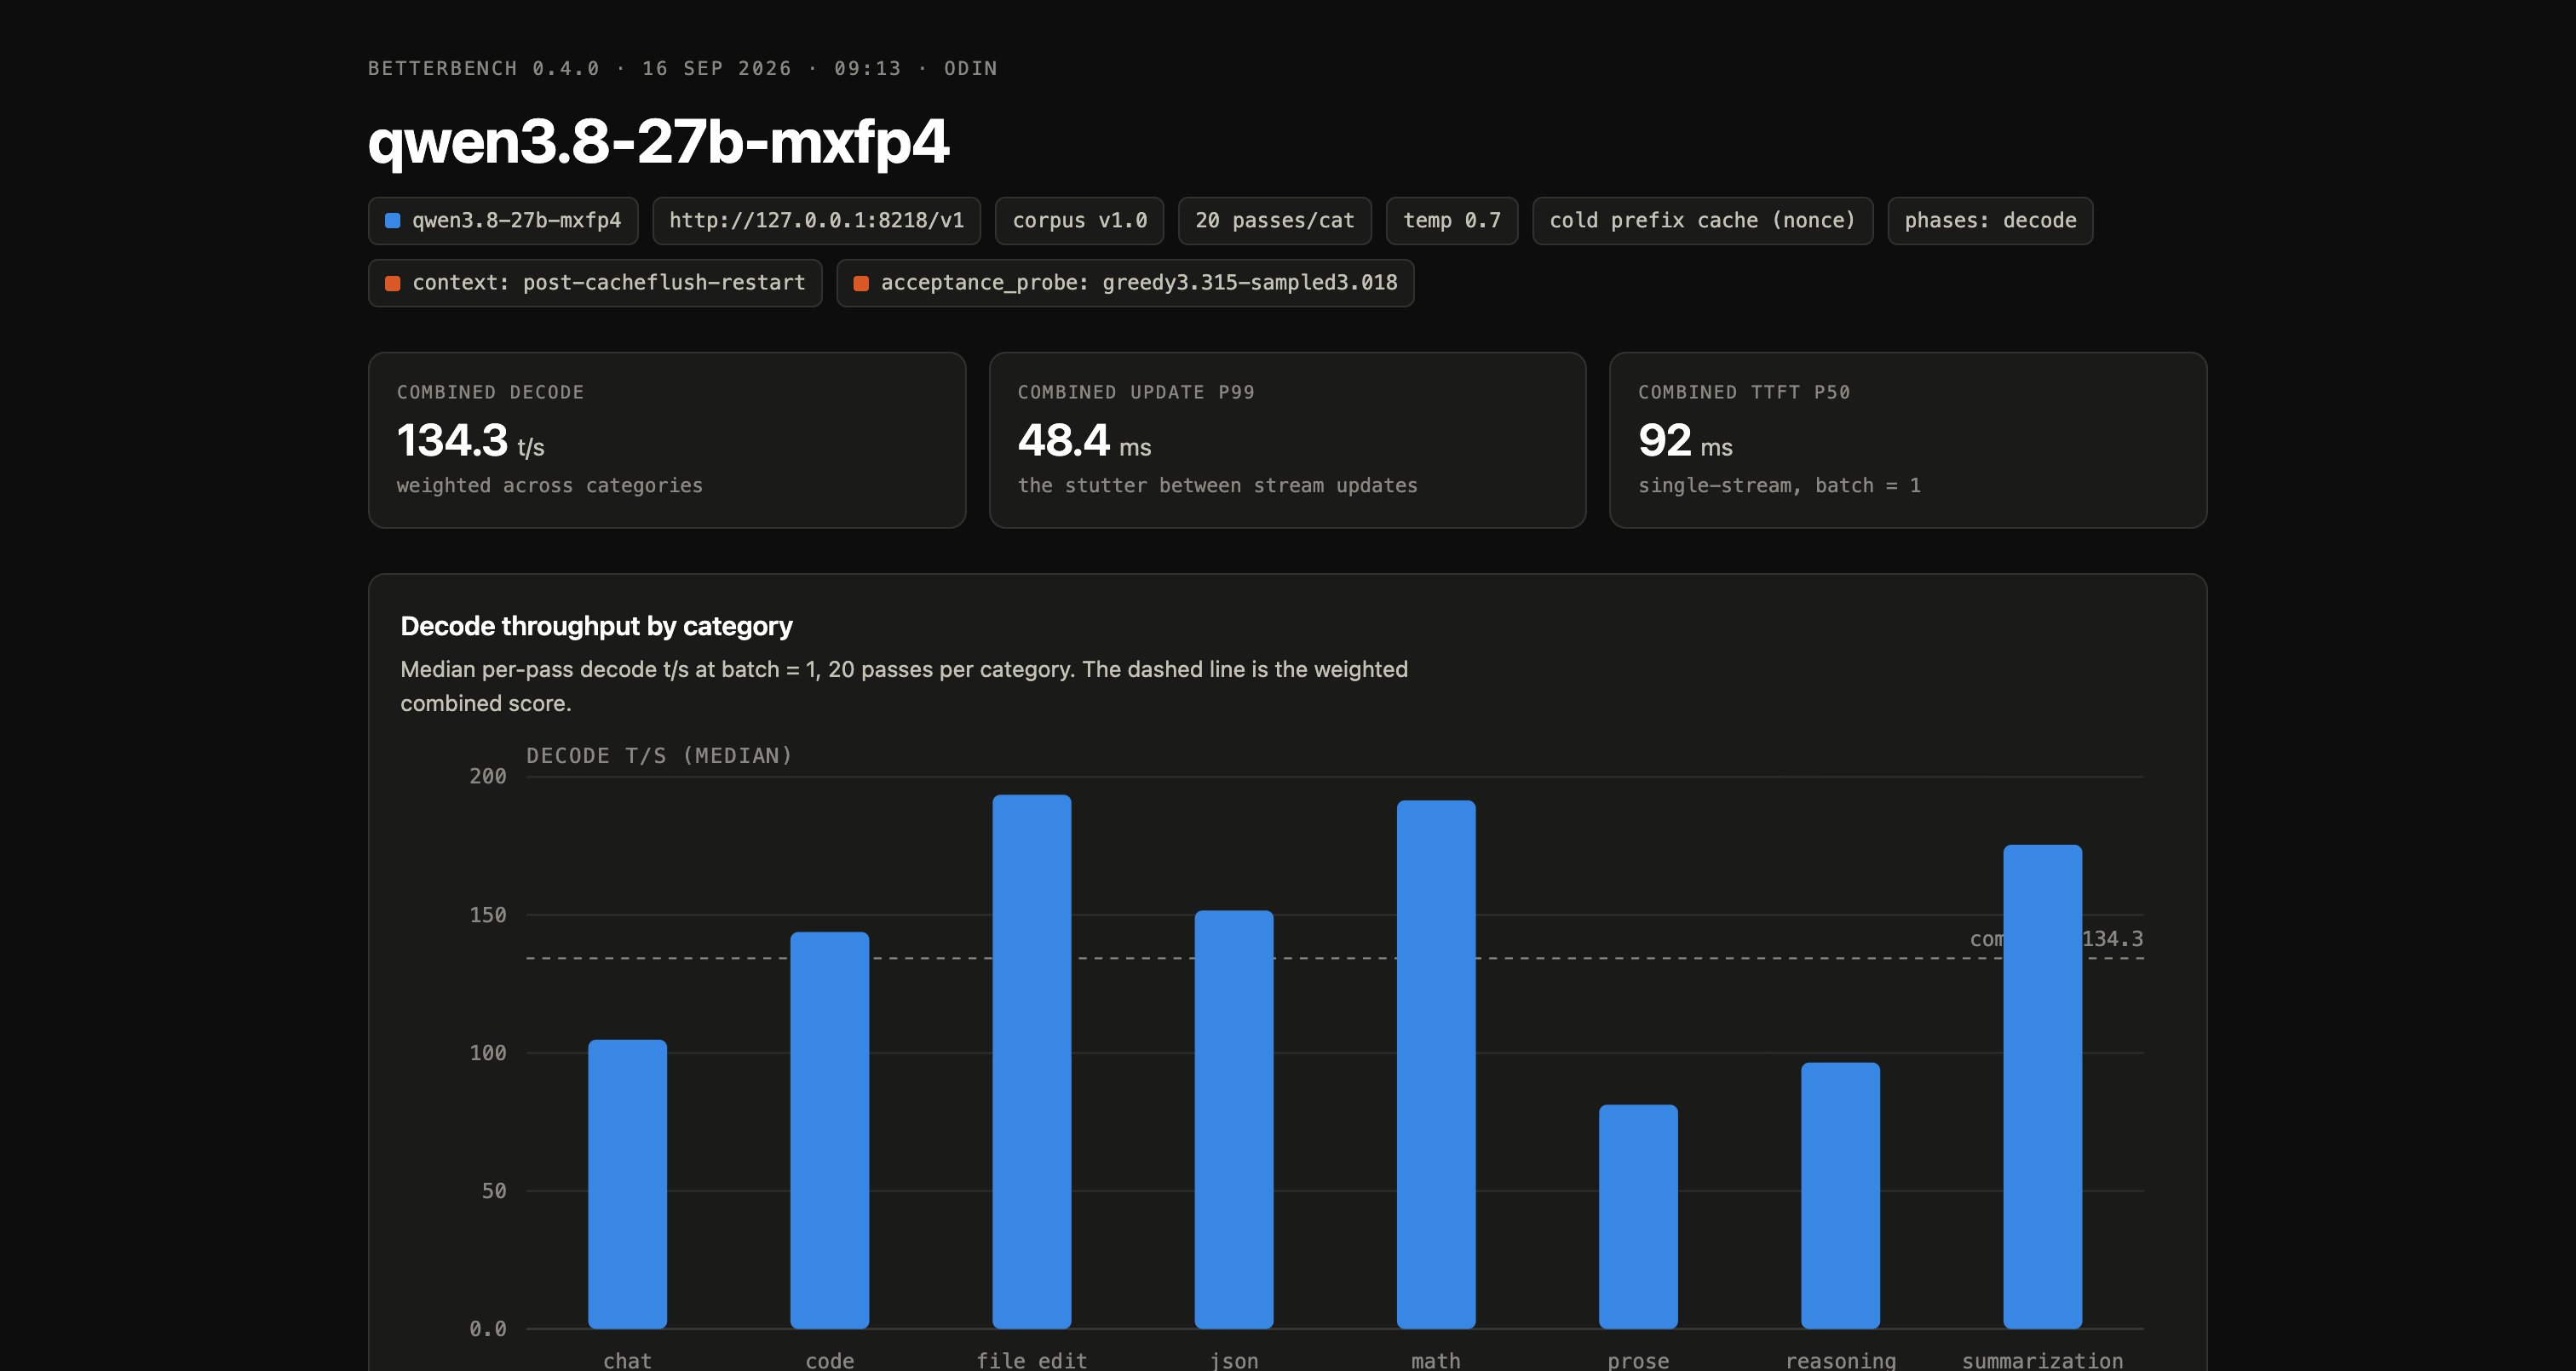
weighted decode median         34.0 t/s   134.3 t/s     (3.95x)
update p99                      39.9 ms    48.4 ms
TTFT p50                          112 ms     92 ms
137 of 160 runs hit max_tokens in both runs alike (a thinking model at this depth); the comparison is like-for-like. Update p99 rose slightly with tokens landing four at a time instead of one — the stutter measures the same wall-clock gap carrying 4× the payload.
Quality
Speculative verification preserves the output distribution by construction, and that held here: completions were correct throughout the broken period, which is precisely why the regression survived four days unnoticed. BetterBench answer rates on the fixed run — prose 95%, reasoning 91%, json and code in band with the earlier baseline — moved with throughput, not against it.
The report, unedited
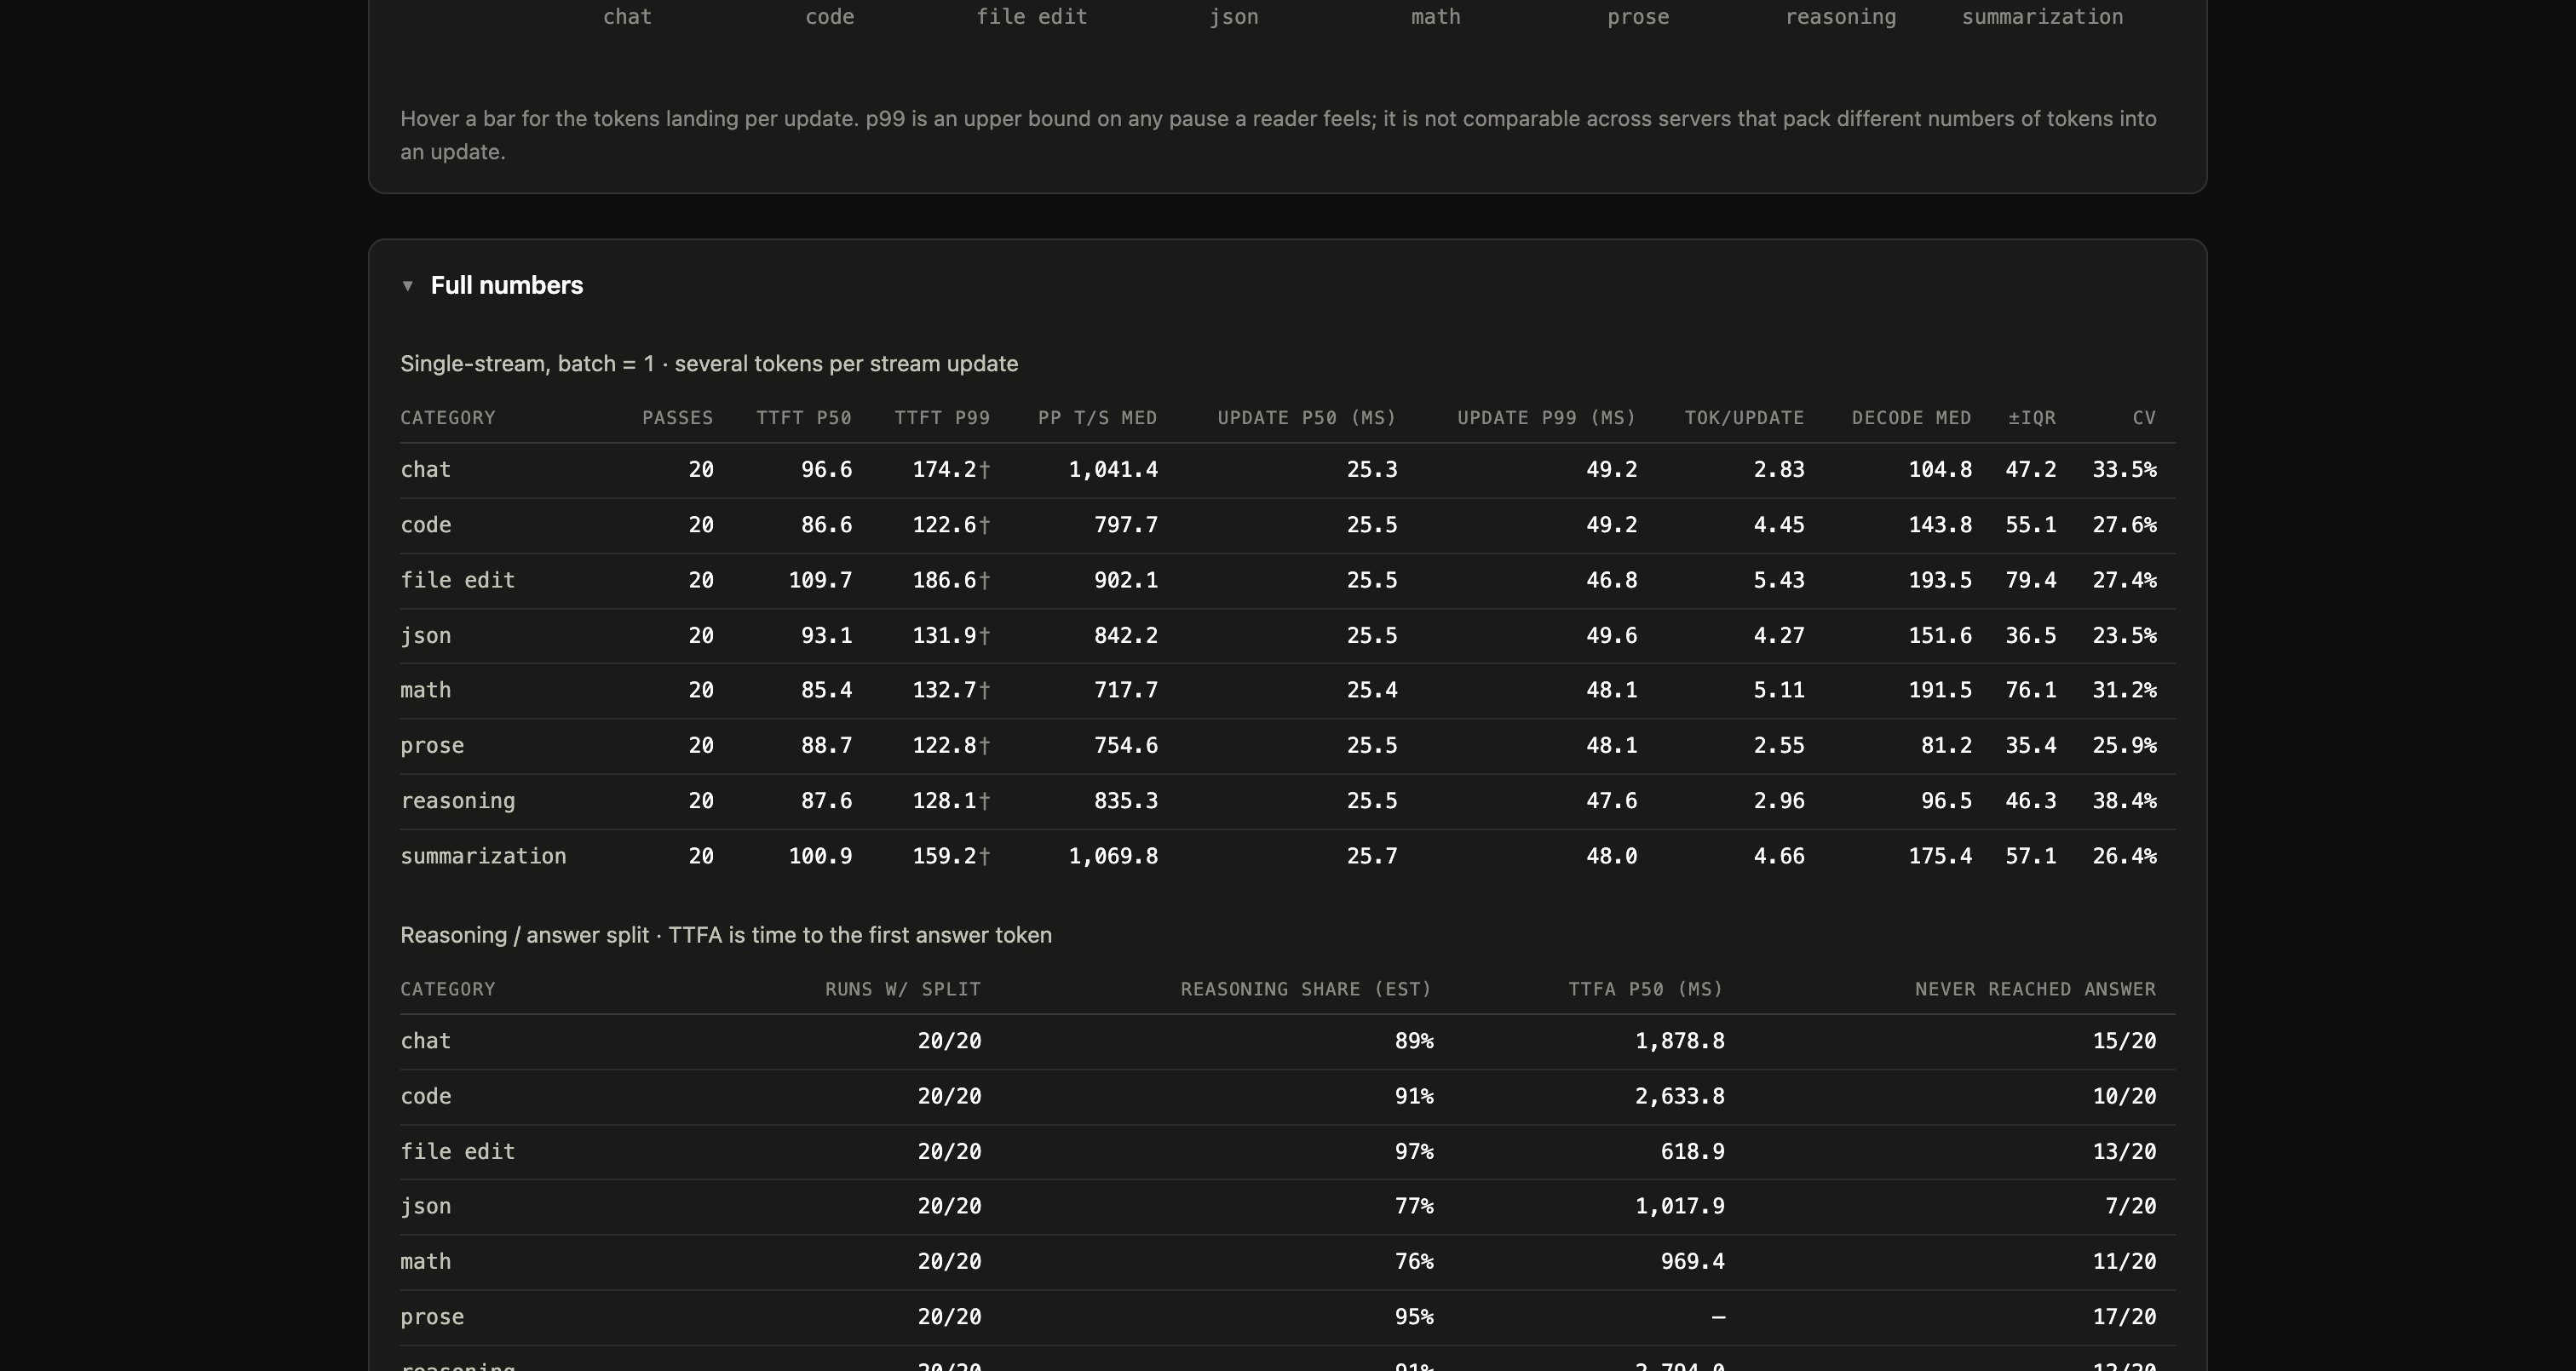
BetterBench's own charted report for the fixed run, as it rendered on the bench. The per-category rows below carry the full picture: TTFT, prefill split, update-gap percentiles, tokens-per-update, and per-category decode medians with their interquartile ranges.
Per-category, as a table
| category | TTFT p50 | update p99 | tok/update | decode t/s | ±IQR |
|---|---|---|---|---|---|
| code | 86.6 ms | 49.2 ms | 4.45 | 143.8 | 55.1 |
| file_edit | 109.7 ms | 46.8 ms | 5.43 | 193.5 | 79.4 |
| json | 93.1 ms | 49.6 ms | 4.27 | 151.6 | 36.5 |
| math | 85.4 ms | 48.1 ms | 5.11 | 191.5 | 76.1 |
| summarization | 100.9 ms | 48.0 ms | 4.66 | 175.4 | 57.1 |
| chat | 96.6 ms | 49.2 ms | 2.83 | 104.8 | 47.2 |
| reasoning | 87.6 ms | 47.6 ms | 2.96 | 96.5 | 46.3 |
| prose | 88.7 ms | 48.1 ms | 2.55 | 81.2 | 35.4 |
Tokens-per-update is the speculative signature visible per category: structured output (file_edit 5.43, math 5.11) accepts deep drafts, while prose (2.55) and chat (2.83) break the drafter's stride — which is exactly why the weighted mix, not a favorite category, has to be the headline number.
What remains of the gap
The public R9700 result this all started from — 276–285 t/s decode — is a two-card setup, like this one. On the like-for-like weighted-combined metric, their build documents 174.9 t/s against our 134.3: a residual of 1.30x, and that is software, not silicon. Their stack is five-plus releases ahead (a versioned overlay on the same base), and its own performance ledger enumerates where the difference lives: a decode launch-gap stack worth +14%, dynamic verify width (+11–13% at concurrency), fragment-order weights and nontemporal decode loads (−5.4% per step), an int2 verify head (+2.9%), KV-cache group sizing (+20% resident tokens). Individually gated, honestly reported, and together about the size of the gap that remains.
The saturation curve (added post-run)
A concurrency sweep on the same fixed serve (10 passes, 48 requests per level, cold prefix-cache) fills in the missing dimension of the story: how the pair scales when loaded, not just one stream at a time.
| concurrency | aggregate t/s | TTFT p50 | per-req decode t/s |
|---|---|---|---|
| 1 | 115.5 | 95 ms | 134.4 |
| 2 | 194.1 | 122 ms | 118.3 |
| 4 | 279.4 | 143 ms | 89.5 |
| 8 | 359.8 | 726 ms | 69.9 |
| 16 | 391.0 | 7.4 s | 72.8 |
The pair saturates around 391 t/s aggregate. The TTFT cliff past concurrency 4 is the max_num_seqs: 8 admission ceiling — requests queue at capacity rather than the model slowing down, which is the correct failure shape. Two conclusions follow: all four cards as two pairs carry roughly double both numbers (~780 t/s ceiling, 16 admission slots), and per-request decode falls with batching (134 to 70 t/s) as the fixed verify cost amortizes differently across the batch — the single-stream 134.3 and the c8 359.8 are both true, and they are different questions. The sequential-phase Combined of this same run measured 132.6 against the main run's 134.3 — two independent invocations agreeing within 1.3%, which is the warm-floor stability the harness exists to give.
Prefill across prompt depth
The prompt-processing arm (10 passes per depth, tiny decode, cold prefix cache): throughput as prompt tokens ÷ TTFT.
| prompt tokens | TTFT p50 | PP t/s (median) |
|---|---|---|
| 1.5 k | 464 ms | 3260 |
| 5.9 k | 1.70 s | 3480 |
| 11.8 k | 3.32 s | 3556 |
| 23.5 k | 6.71 s | 3511 |
| 47.1 k | 13.87 s | 3391 |
Prefill throughput is flat within 8% from 1.5k to 47k tokens — the chunked pipeline (8192-token chunks) does not fall off with depth on this stack. Against the public result's 5809 t/s prefill the residual here is ~1.6x, consistent with their ledger's prefill-specific gains (fp8 attention legs, epilogue width) stacking on top of the same ~1.3x decode-side story.
Why not four cards?
Four R9700s sit in this chassis, and the serve uses two. That is not waste by choice: the four cards split two per socket, cross-socket peer DMA does not exist on this platform, and therefore cross-socket HIP IPC fails (hip_err=17) — every accelerated all-reduce in a four-card TP group host-stages through shared memory. Measured on this exact bench, same binary, only the grouping differing: TP4 across sockets gave 360.1 t/s aggregate at concurrency 8 — worse than one socket-local TP2 pair at 448.3, because the collective is 0.22 ms of a step that host-staging makes the long pole. The topology that actually uses all four cards is two socket-local TP2 replicas side by side: 607.6 t/s aggregate measured. That benchmark — two replicas, per-pair caches, interleaved arms — is the follow-up this fix unblocks.
Platform caveats, stated
Numbers from this bench carry three asterisks a reader should weigh. First, the PCIe root complexes: 09:00.0 trains x8 permanently (its IIO is bifurcated, the other eight lanes carry a 25 GbE ConnectX), so the two socket-local pairs are asymmetric in host-to-device bandwidth — 20.5 GB/s for the {05, 09} pair this serve runs on against 27.2 GB/s for{86, 89} — and a latency-sensitive replica would rather live on the second pair. Second, this board is an interim MACHINIST X99-D8 MAX; on a previous boot, two of the four links had silently negotiated down (6,655 BadTLPs on one root, Gen1 on another) with static AER, and everything measured that day was against degraded hardware without looking like it. Loose cables re-seated, reboot, links verified — but the lesson stands and so does the check:
for c in /sys/class/drm/card*/device; do
  cat "$c/uevent" | grep PCI_SLOT_NAME
  cat "$c/pp_dpm_pcie"   # the starred row is the ACTIVE state
done
lspci's LnkSta lies on this Broadwell-EP platform — it will cheerfully report Gen5 x16 for a card on a Gen3 bus. Third, the entry-level CPUs under four server GPUs: a dual E5-2620 v4 feeds a 19 GB target and its drafter across a PCIe 3.0 host fabric, and any benchmark that touches the host path inherits that ceiling. A faster platform would move the prefill column; it would not have hidden a stale cache.
The general lesson
Cache keys must include every graph-changing variable, and a cache directory name is not a cache key. The launcher changed image, model paths, and draft arm on 09-06 and kept the directory name; the 09-13 restart paid for it with a silent quarter-speed serve. The instrumentation that catches this class already exists in vLLM's spec-decode counters — but only if something reads them. A gauge nobody watches is the same as no gauge. Wire acceptance length into the serving dashboard, and treat "lossless but slow" as the signature of a verifier doing its job over a drafter that lost its mind.